The useful part came from splitting Claude into two jobs
I got a production logging system working faster when I stopped asking Claude to write code first. The better pattern was consultant first, implementer second. One Claude instance designed the logging approach, pressure-tested edge cases, and explained trade-offs. A separate Claude session wrote the code from that plan. Even with that setup, it still introduced two bugs that made it to runtime. Both were fixable, and both taught me where this pattern helps and where it doesn’t.
This was inside MakerWS while building Hot Glue. I needed logs that were useful in production, not a wall of console output that looked busy but told me nothing once multiple requests were happening at once. I wanted structured logs, request correlation, environment-aware formatting, and a way to avoid leaking secrets. I also wanted something simple enough that I could inspect the whole stack without digging through a giant observability product.
The final setup used Pino on the server, a request ID attached at the edge of each request, pretty printing in development, JSON logs in production, and serializers to keep the output readable. It worked well. But the interesting part wasn’t the logger itself. It was how Claude behaved when I asked it to act like a consultant first.
Why I changed the way I prompted it
My first attempt was the common one: “build me a production logging system for this app.” Claude responded with a plausible implementation, but it jumped too quickly into files and code. That sounds efficient. It wasn’t. Logging touches request lifecycle, deployment setup, server framework details, data sensitivity, and team workflow. If the early assumptions are wrong, you don’t find out until after you’ve wired it through half the app.
So I rewrote the prompt and gave Claude a narrower role. I told it not to generate implementation code yet. I asked it to act like a software consultant reviewing an existing product with these goals:
- understand the current stack and constraints
- propose a logging architecture for production and local development
- identify risks, especially around PII and noisy logs
- define file boundaries and integration points
- wait for approval before writing code
I also pasted concrete context from the app. I included the server framework, where API routes lived, how auth worked, what deployment environment I was using, and examples of the current ad hoc console logs I wanted replaced. That changed the quality of the output a lot. Claude started asking the right questions because it had permission to stay in planning mode.
Do not implement yet. First, review the architecture and propose a production-safe logging design. Assume I care about request tracing, structured JSON logs in prod, readable logs in dev, and avoiding accidental secret leakage. Name the files you would create or change and why.
That one sentence, “Do not implement yet,” mattered more than I expected. Without it, Claude kept collapsing planning and coding into one step.
What the consultant Claude actually produced
The planning output was good because it was specific. It didn’t say “use structured logging” and stop there. It recommended Pino, explained why it fit a Node server better than trying to standardize plain console output, and split the system into a few clear pieces:
- a base logger module with environment-specific transport
- request-scoped child loggers carrying a requestId
- serializers and redaction rules for headers, auth tokens, and payloads
- a thin wrapper or helper to keep call sites consistent
- middleware to attach correlation data once per request
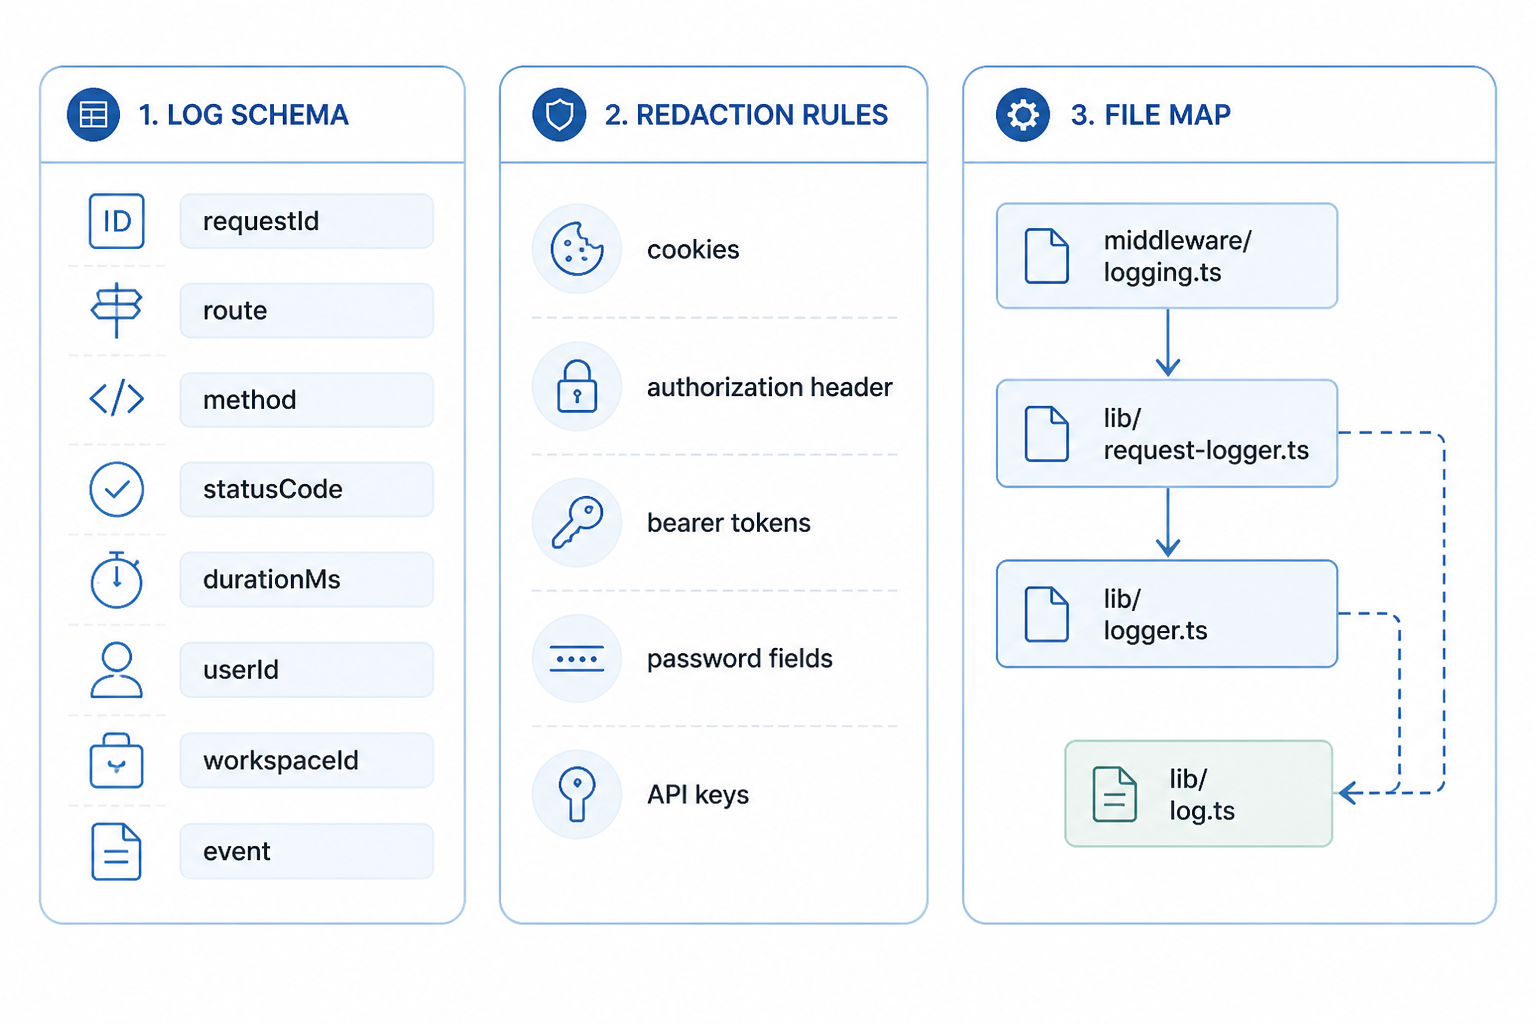
It also recommended choosing a log schema up front. That was a good call. If one route logs userId and another logs user_id, the logs become hard to search and harder to reason about. So before writing any code, I locked in some standard keys: requestId, route, method, statusCode, durationMs, userId, workspaceId, and event.
Claude also pushed for explicit redaction. Not “be careful with sensitive data.” Actual paths. Cookies, authorization headers, bearer tokens, password fields, and API keys. That part was useful because logging systems fail quietly. You don’t notice a bad redaction policy until sensitive values have already been written somewhere durable.
The file structure I ended up using
After reviewing the plan, I asked a second Claude session to implement it. I gave it the approved architecture and told it to stick to that design unless it found a conflict in the codebase. The final structure was close to what the consultant proposed.
| File | Purpose |
| lib/logger.ts | Creates the base Pino logger, transport config, serializers, and redaction rules |
| lib/request-logger.ts | Builds child loggers with request context like requestId and route metadata |
| middleware/logging.ts | Generates request IDs and attaches request timing |
| lib/log.ts | Small helper exported for app-wide logging calls |
| api route handlers | Use request-scoped logger instead of console statements |
I kept this intentionally small. No custom transport pipeline. No log shipping code inside the app. No homegrown dashboard. The app’s job was to produce clean structured logs. Everything after that could be handled by the runtime and whatever log sink we chose later.
In development, the logger used a pretty transport so I could read nested objects and timing without staring at raw JSON. In production, it emitted line-delimited JSON. That split sounds obvious, but I had to force it into the design early because otherwise development-friendly formatting leaks into production and breaks downstream parsing.
What I asked the implementer Claude to do
The second prompt was stricter than the first. I pasted the approved plan and told Claude to implement only that. I also asked it to show where it was making assumptions. This helped, but it didn’t eliminate mistakes.
Implement this exact logging design. Preserve the file boundaries. If a framework detail is unclear, stop and state the assumption instead of inventing an API. Prefer small changes to existing route handlers over broad refactors.
That produced code I could review quickly. Most of it was solid. The logger factory was clean. The redaction config was reasonable. Child loggers were created correctly in the happy path. The request timing logic was also fine. But two issues slipped through.
Bug one: the request ID existed, but didn’t survive the whole request path
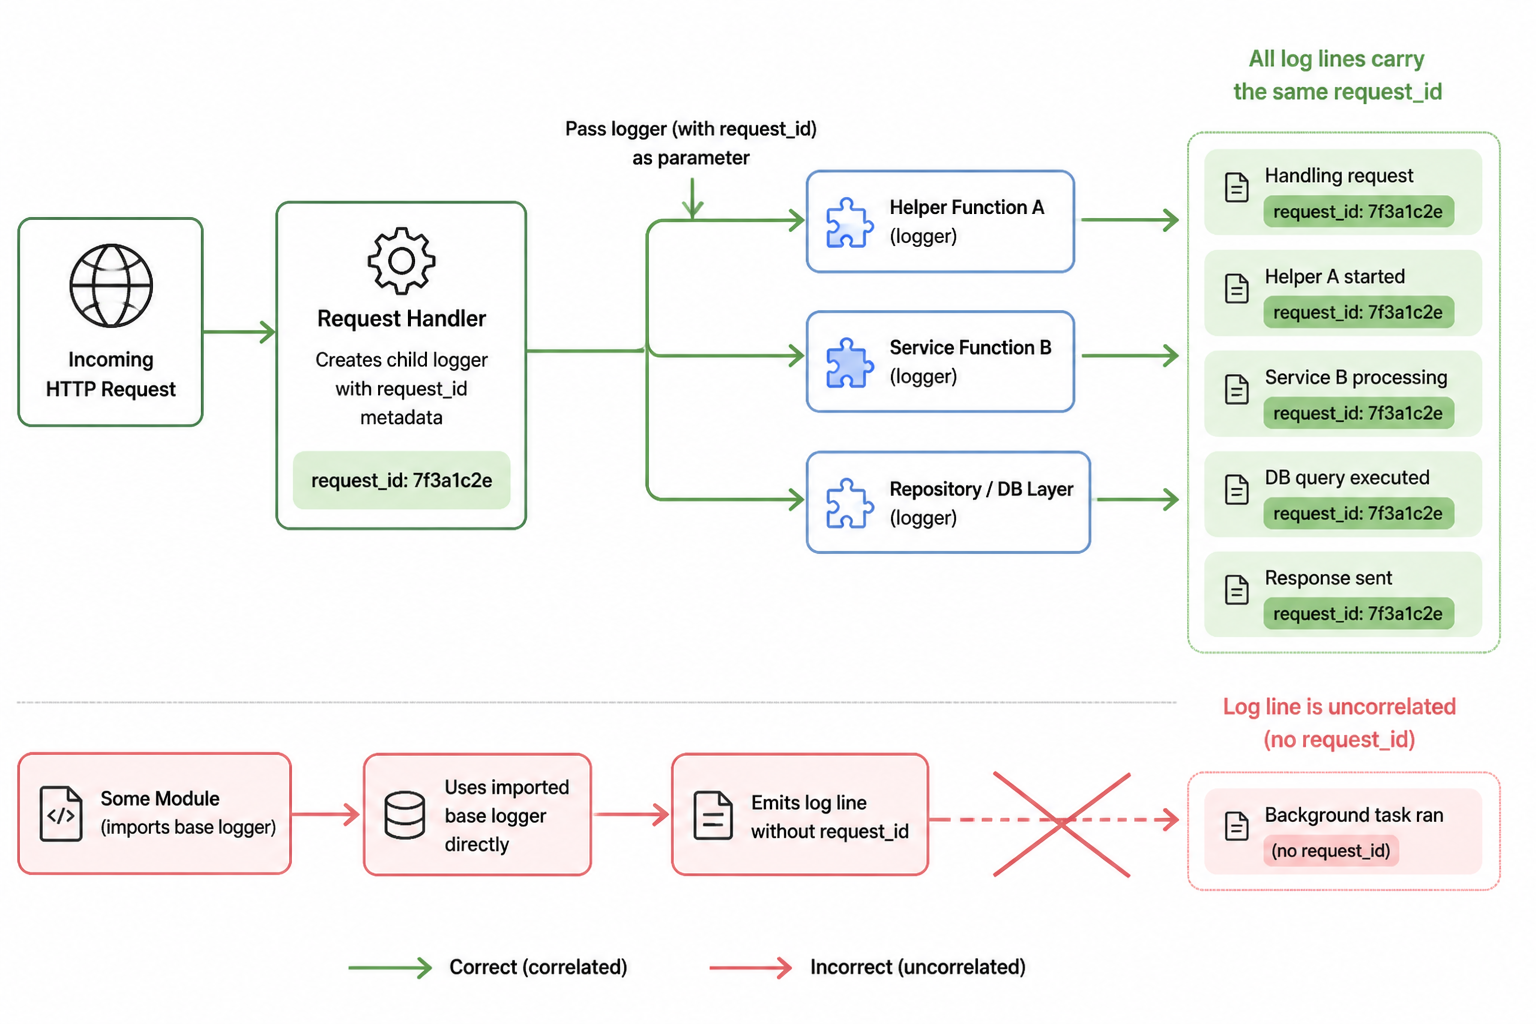
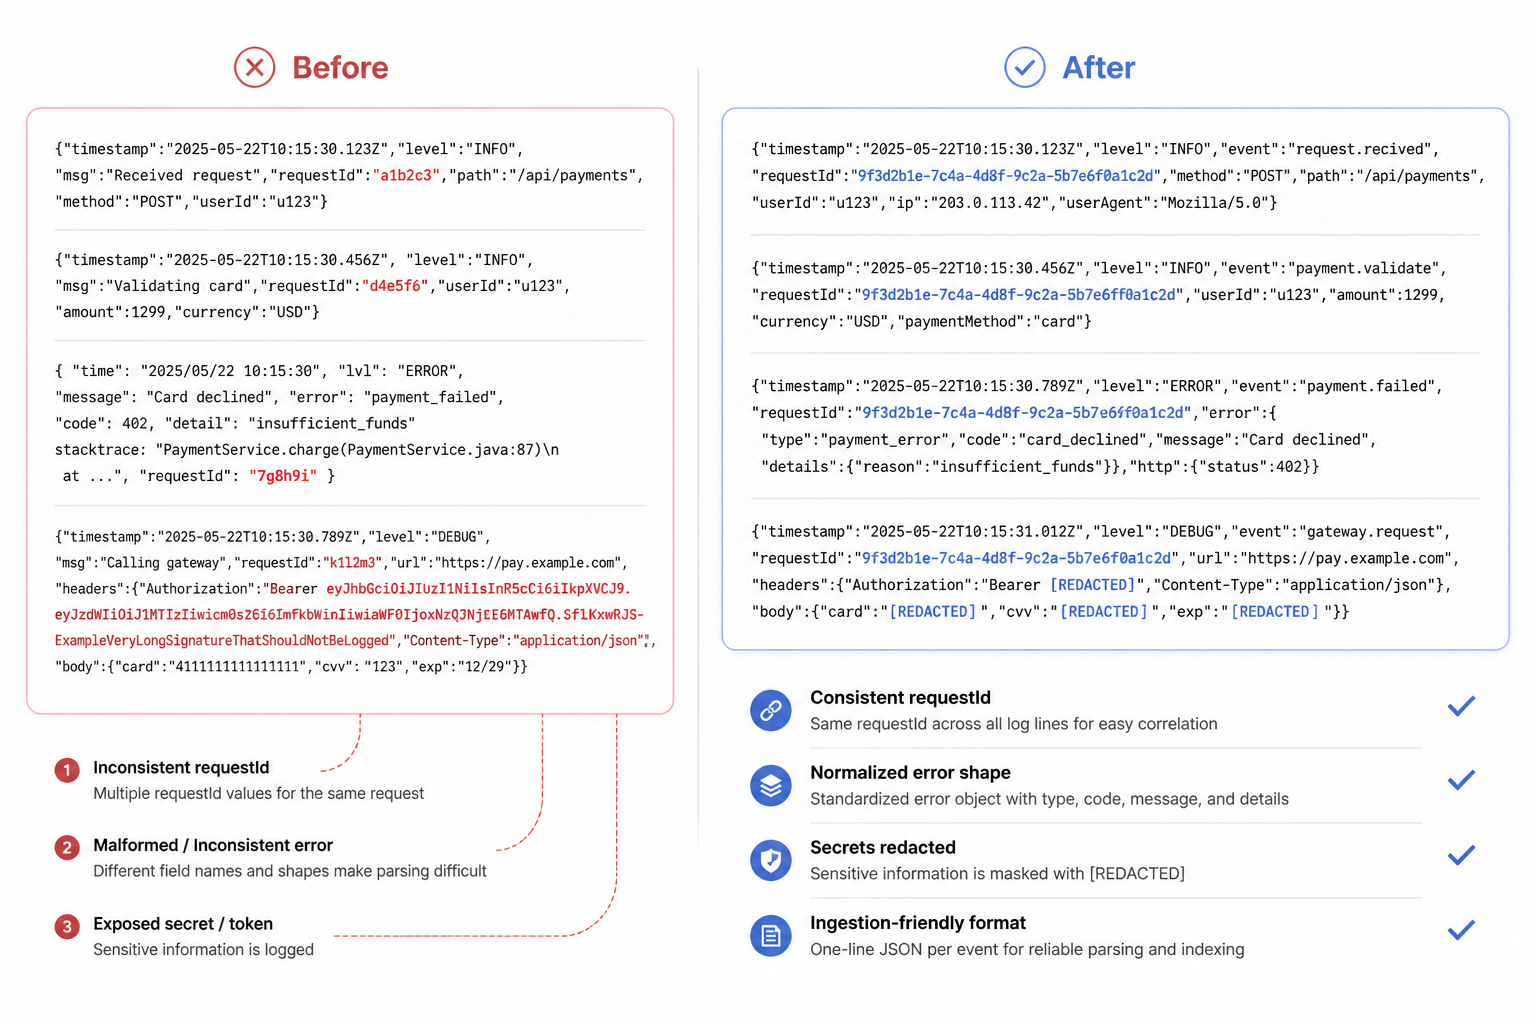
The first bug was subtle. Claude generated middleware that created a request ID and attached it to the request context, but one layer deeper, route handlers created fresh logger instances instead of deriving child loggers from the request logger. So some log lines had the right requestId, and some didn’t. In a single local request, that wasn’t obvious. In concurrent traffic, it made the logs much less useful.
I found it by making a request that triggered multiple internal operations and then grepping the output for the ID. A few lines matched. Others were missing the field entirely. That told me correlation wasn’t actually end to end.
The root cause was straightforward. Claude understood the concept of request-scoped logging, but at implementation time it mixed two access patterns:
- use the base logger directly from imported modules
- use a child logger built from request metadata
Those two patterns can’t coexist if you want clean traceability. The fix was to make the request logger the default inside handlers and helper functions reached during a request. I changed a few signatures so functions accepted a logger parameter when they were called inside request flow. That felt slightly more manual than the original generated code, but it removed ambiguity. If something was request-bound, it got a request-bound logger.
This is one place where consultant first helped. The architecture was right. The bug happened in execution, not design. Because I already had a clear design, I knew exactly what was wrong when the runtime behavior didn’t match it.
Bug two: redaction covered the obvious fields, but missed nested payloads
The second bug was more serious. Claude set up Pino redaction for top-level fields like req.headers.authorization and password, but one of the route handlers logged a nested object from a third-party response and that object contained a token field under a different path. The logger printed it.
This is the kind of mistake that looks fine in a code review because the redaction array appears thoughtful. It had the standard paths. It even had wildcard coverage for a few common shapes. But the app wasn’t logging a generic request body in that case. It was logging a processed integration payload whose schema didn’t match the expected redaction paths.
I caught it during manual testing because I inspect logs aggressively when introducing anything that touches auth or external APIs. One line included a field that should never have been emitted. It wasn’t live customer data, but that didn’t matter. The policy had failed.
The fix had two parts. First, I expanded redaction to include the nested paths I knew about. Second, I stopped logging whole payloads from that integration path. That was the bigger lesson. Redaction lists don’t scale if your habit is “dump the object and trust the logger.” It’s safer to log specific fields that you want than to log large objects and hope the denylist catches everything.
After that, I changed my prompt style for anything involving logs, telemetry, analytics, or errors carrying remote payloads. I now tell Claude to default to allowlist logging. Name the fields to include. Avoid logging whole request or response objects unless there is a hard debugging reason and a reviewed serializer in place.
What the consultant-first pattern did well
This pattern worked because it separated system design from token-by-token code generation. Claude is much better when it can think about boundaries before it has to satisfy syntax. Once I stopped asking for a one-shot answer, it gave me clearer trade-offs.
For example, it explained why I probably didn’t need distributed tracing yet. I wanted request correlation inside one app instance, useful operational logs, and enough metadata to trace failures through route handlers and background jobs. Full tracing infrastructure would have been more moving parts than I needed. That saved time and complexity.
It also helped me avoid overengineering the API around logging. My first instinct was to create a large abstraction layer with methods like logAuthEvent, logDbEvent, logWebhookEvent. Claude pushed toward a thinner wrapper and richer structured fields. That was the right call. Event naming plus context fields turned out to be enough, and it kept adoption simple.
What it still didn’t solve
The pattern does not remove the need for runtime verification. It mainly improves the quality of the first implementation. Claude can still write code that matches the plan in spirit while failing in details that only show up under real execution.
Logging is especially vulnerable to this because correctness isn’t binary. The app can run while the logs are incomplete, inconsistent, or unsafe. A broken route usually crashes fast. A broken logging system can look healthy for days.
So I added a short validation pass whenever I change logging now:
- send concurrent requests and confirm every line has the same requestId per request
- trigger handled and unhandled errors and inspect the output shape
- grep for known secret-like values from test fixtures
- check one production-like JSON line to make sure ingestion-friendly formatting is intact
That check takes a few minutes and catches the kinds of mistakes that code review misses.
The trade-offs I made on purpose
I didn’t try to solve every observability problem here. No span trees. No centralized schema registry. No custom log dashboard. That was a deliberate constraint. Hot Glue needed logs I could trust during active development and in production incidents. It did not need a platform project.
I also accepted a little verbosity in function signatures to preserve request-scoped logging. Passing a logger into lower-level functions isn’t as slick as pulling a singleton from anywhere, but it makes context explicit. In practice, that made the code easier to reason about, especially in async paths where hidden globals become messy fast.
The last trade-off was keeping the redaction strategy conservative. This means some logs contain less context than would be ideal during debugging. I’m fine with that. Missing a nonessential field is cheaper than leaking a credential.
How I’d prompt Claude differently next time
If I were starting from zero again, I’d keep the same consultant-first structure but tighten the prompts around failure modes. I would explicitly ask for:
- how request context survives async boundaries
- which exact log fields are allowlisted per event type
- what test cases prove redaction is working
- where the implementation is likely to drift from the design
I would also ask the implementer Claude to produce a short “risk review” after writing the code. Not a generic summary. A list of places where the implementation might be incorrect because of framework assumptions or incomplete schema knowledge. That kind of self-critique is often more useful than another pass of generated code.
What changed in the app after this was in place
Once the logging system was stable, debugging got less chaotic. I could trace a single request through auth, route logic, and downstream operations without reconstructing the timeline from mixed console output. Error logs became easier to scan because they had consistent fields. Local development improved too because the pretty output showed enough context without flooding the terminal.
The bigger shift was behavioral. Because the logger made structured fields easy to add, I stopped writing vague messages like “webhook failed” and started logging events with context that actually matters, like route, upstream status, workspace, and timing. That’s not Claude magic. That’s what happens when the system makes the better habit easier than the sloppy one.
My takeaway
The consultant-first pattern is useful when the task has architecture in it, not only syntax. Logging definitely does. Asking Claude to plan first gave me a better system with clearer boundaries and fewer pointless refactors. But it didn’t make the implementation self-verifying. Claude still missed request-scope consistency in one path and redaction coverage in another.
So that’s where I landed: use one AI pass to think, another to build, and then verify the parts that only reality can verify. For this logging system, that was enough to get something production-friendly without turning the whole effort into an observability side quest.